
What Is the Digital PSAT? A Complete Overview
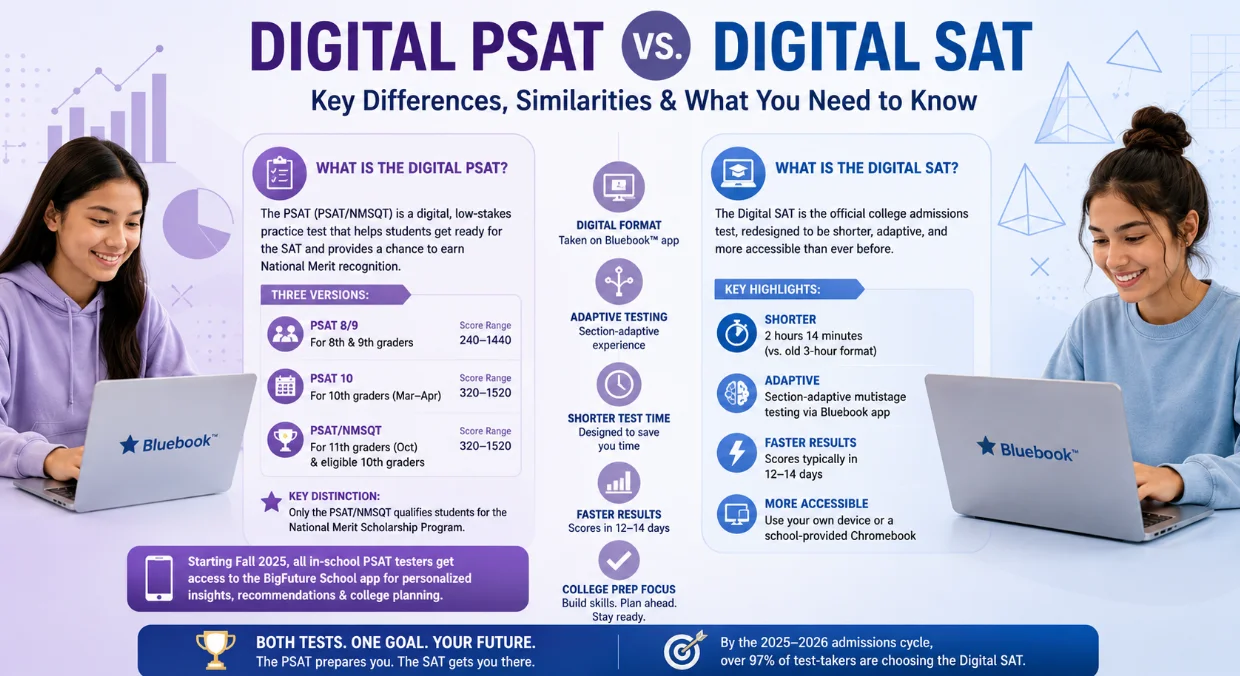
The Preliminary Scholastic Aptitude Test (PSAT) formally known as the PSAT/NMSQT (National Merit Scholarship Qualifying Test) is a College Board standardized assessment designed to give high school students an early, low-stakes preview of the SAT experience. Since fall 2023, the PSAT has been administered exclusively through the College Board’s Bluebook™ app in a fully digital, adaptive format.
There are actually three versions of the PSAT, each targeting a different grade level:
- PSAT 8/9 — For students in 8th and 9th grade. Scored 240–1440.
- PSAT 10 — For 10th graders, administered in March–April. Scored 320–1520.
- PSAT/NMSQT — For 11th graders (and eligible 10th graders), administered every October. Scored 320–1520. This is the only version that qualifies students for the National Merit Scholarship Program.
Key distinction: While the PSAT 10 and PSAT/NMSQT share identical content and difficulty levels, only the PSAT/NMSQT scores count toward National Merit recognition.
One of the biggest misconceptions about the PSAT is that it is “just a practice test.” For juniors, it serves as a high-stakes qualifying exam for one of the most prestigious academic honors in the United States the National Merit Scholarship.
Starting Fall 2025, all in-school PSAT testers (including PSAT 8/9) gain access to the BigFuture School app, providing score insights, personalized recommendations, and college planning resources.
What Is the Digital SAT? Everything You Need to Know
The Digital SAT is the fully revamped version of the College Board’s flagship college admissions exam. It transitioned to a fully digital, adaptive format for U.S. students in March 2024, completing the College Board’s broader digital transformation of the entire SAT Suite of Assessments.
Unlike the PSAT, SAT scores are sent directly to colleges and universities and carry significant weight in the admissions process. The digital SAT is:
- Shorter — 2 hours and 14 minutes vs. the old 3-hour format
- Adaptive — Section-adaptive multistage testing via the Bluebook app
- Faster results — Scores are typically released within 12–14 days of the test date
- More accessible — Students use their own laptop, tablet, or a school-provided Chromebook
By the 2025–2026 admissions cycle, over 97% of SAT test-takers are opting for the digital format, cementing the Digital SAT as the definitive standardized college admissions assessment.
Digital PSAT and Digital SAT Subjects Comparison
Both the Digital PSAT and Digital SAT test the same two core academic domains: Reading & Writing and Math. However, there are important differences in content depth, topic coverage, and complexity.
Reading & Writing Section: PSAT vs. SAT
Both exams present short passages of 25–150 words, each paired with a single question a dramatic departure from the 500–750-word passages of the paper era. However, the SAT’s passages tend to be more nuanced and thematically complex.
Four domains tested in Reading & Writing (both exams):
| Domain | Description |
|---|---|
| Craft and Structure | Vocabulary in context, text structure, author's purpose |
| Information and Ideas | Reading comprehension, evidence-based reasoning |
| Standard English Conventions | Grammar, punctuation, sentence boundaries |
| Expression of Ideas | Transitions, rhetorical synthesis, note-based writing |
Key difference: The SAT’s Reading & Writing section features more advanced inference questions, occasional literary texts (poems, plays), and “bulleted notes synthesis” questions that require higher-order critical thinking not typically found on the PSAT.
Question order within each module is consistent: Words in Context → Information & Ideas → Craft & Structure → Expression of Ideas → Standard English Conventions, progressing from easier to harder within each domain group.
Math Section: Digital PSAT vs. Digital SAT
Both exams cover four math content areas, but the SAT assigns greater weight to Advanced Math and includes more complex multi-step reasoning:
| Math Content Area | Weight / Coverage |
|---|---|
| Algebra | PSAT: ~40% • SAT: ~35% |
| Advanced Math | PSAT: ~30% • SAT: ~35% |
| Problem Solving & Data Analysis | ~15% on both PSAT and SAT |
| Geometry & Trigonometry | ~15% on both PSAT and SAT |
What the SAT covers that the PSAT does not (or covers minimally):
- More complex systems of equations
- Higher-order polynomial reasoning
- More advanced trigonometry applications
- Harder word problems requiring multi-step algebraic modeling
What both exams exclude: Complex numbers, logarithms, vectors, conics, matrices, and limits these topics are intentionally kept off both tests.
Shared features across both Math sections:
- Full-test calculator access (Desmos-based graphing calculator built in)
- Both multiple-choice and student-produced response (grid-in) questions
- No “no-calculator” section eliminated in the digital format
- Word problems capped at approximately 50 words for clarity
- Adaptive difficulty routing between modules
SAT and PSAT Test Structure & Format
Understanding the structural architecture of both exams is essential for strategic test preparation. Here is a comprehensive side-by-side format comparison:
Complete Format Comparison Table
| Feature | Details PSAT / SAT |
|---|---|
| Total Duration | 2 hours, 14 minutes |
| Total Questions | 98 |
| Sections | 2 (Reading & Writing, Math) |
| Modules per Section | 2 (Adaptive) |
| Reading & Writing Questions | 54 (27 per module) |
| Reading & Writing Time | 64 minutes (32 per module) |
| Math Questions | 44 (22 per module) |
| Math Time | 70 minutes (35 per module) |
| Score Range | PSAT: 320–1520 • SAT: 400–1600 |
| Section Score Range | PSAT: 160–760 per section • SAT: 200–800 per section |
Notable fact: The digital PSAT is 31 minutes shorter than the old paper PSAT (which was 2 hours and 45 minutes), while the digital SAT is approximately 46 minutes shorter than the legacy paper SAT (3 hours).
What’s on the Bluebook App
Both tests are administered through College Board’s Bluebook™ app, which students download on their own device (Windows, Mac, iPad, or school-managed Chromebook). Bluebook includes:
- Built-in Desmos graphing calculator (available throughout the Math section)
- Question flagging for review within a module
- Text highlighting and annotation tools
- Built-in timer with the ability to view time remaining
- Answer elimination tool for process-of-elimination strategy
- Device lockdown mode to prevent access to other apps mid-test
- Offline resilience test data is downloaded before you begin, so connectivity interruptions don’t invalidate sessions
Adaptive Testing: How Bluebook Multistage Testing Works
The most transformative feature of both the Digital PSAT and Digital SAT is multistage adaptive testing (MST) and understanding how it works gives you a significant strategic advantage.
The Two-Module Adaptive Architecture
Each section (Reading & Writing and Math) is divided into two modules:
Module 1 (Base Module): All test-takers receive the same difficulty level. This module acts as a routing test. Your performance here determines which version of Module 2 you receive.
Module 2 (Adaptive Module): Based on your Module 1 performance:
- Strong Module 1 performance → You receive the harder Module 2, which unlocks access to the higher end of the scoring scale
- Weaker Module 1 performance → You receive the easier Module 2, which caps your maximum achievable score
This is why test prep experts universally agree: Module 1 accuracy is the single most important strategic priority on both the Digital PSAT and Digital SAT.
How Adaptive Testing Affects Your Score
The scoring algorithm uses Item Response Theory (IRT), a psychometric model that:
- Weights harder questions more heavily than easier ones
- Accounts for the specific combination of difficulty routing and correct answers
- Means that a student who gets routed to the harder module and answers 18/22 math questions correctly will score higher than a student routed to the easy module who answers 22/22 correctly
Critical insight: You cannot go back to Module 1 after entering Module 2. Within a module, you can skip, flag, and return to questions freely — but once you advance, that module is locked.
No Wrong-Answer Penalty
Both the Digital PSAT and Digital SAT use a no-penalty scoring system your raw score is simply the total number of correct answers. Blank answers earn zero; guesses at minimum give a 25% probability of earning a point. Always answer every question, even if you need to guess.
PSAT and SAT Scoring Comparison
PSAT Scoring: Scored 320–1520 – National Merit Impact
The PSAT/NMSQT is scored on a 320–1520 scale, with two section scores:
- Reading & Writing: 160–760
- Math: 160–760
The PSAT has limited direct college admissions impact scores are not reported to colleges. However, for 11th graders, the PSAT carries one critical high-stakes consequence: National Merit Scholarship qualification. The National Merit Scholarship Corporation uses a separate metric called the Selection Index (not the composite PSAT score) to determine eligibility.
Selection Index Formula: (Reading & Writing Score × 2 + Math Score) ÷ 10
Example: A student scoring 730 in R&W and 720 in Math would calculate: (730 × 2 + 720) ÷ 10 = 218 Selection Index
SAT Scoring: Scored 400–1600 — Pivotal for College Admissions
The SAT is scored on a 400–1600 scale, with two section scores:
- Reading & Writing: 200–800
- Math: 200–800
Your SAT score is among the most important quantitative signals in your college application. Colleges use it to assess academic readiness, compare applicants across different high school curricula and grading systems, and at many schools as a threshold criterion.
Key scoring features:
- Many colleges practice superscoring taking your highest section scores across multiple test dates
- Students can use Score Choice to select which scores to send
- Most admissions officers view 2–3 SAT attempts neutrally or positively
Section Score Alignment: Why the Ranges Don’t Match
The PSAT and SAT use intentionally aligned-but-offset scoring scales. A 620 in Reading & Writing on the PSAT corresponds to approximately a 620 in Reading & Writing on the SAT, because the College Board designed the PSAT as a slightly less difficult version of the SAT with concorded score percentiles.
PSAT vs SAT Score Conversion Chart (2025–2026)
This conversion chart is built from College Board percentile data for 11th grade PSAT/NMSQT test-takers, cross-referenced with SAT score distributions. Use it to estimate your likely SAT performance range based on your PSAT composite score.
Methodology note: These conversions are percentile-concorded estimates, not exact predictions. Actual SAT scores vary based on prep effort, test-day performance, and which adaptive module path a student receives. Treat these as planning benchmarks, not guarantees.
PSAT to SAT Score Conversion Table (Composite Scores)
| PSAT Score (320–1520) | Estimated SAT Score (400–1600) |
|---|---|
| 320–400 | 400–490 |
| 410–500 | 500–580 |
| 510–600 | 590–670 |
| 610–700 | 680–760 |
| 710–800 | 770–860 |
| 810–900 | 870–960 |
| 910–1000 | 970–1060 |
| 1010–1100 | 1070–1160 |
| 1110–1200 | 1170–1260 |
| 1210–1300 | 1270–1360 |
| 1310–1400 | 1370–1460 |
| 1410–1450 | 1470–1510 |
| 1460–1520 | 1520–1600 |
Real-world example: A student scoring 1150 on the PSAT typically converts to approximately 1260 on the SAT. If their target college has a median SAT of 1350, the realistic improvement goal is roughly 90 points — achievable with focused, sustained preparation over several months.
Section-Level PSAT to SAT Score Conversion
Because the PSAT sections (160–760) and SAT sections (200–800) are concorded, section-level conversion follows a direct alignment for most of the range:
| PSAT Section Score | Estimated SAT Section Score |
|---|---|
| 160–200 | 200–240 |
| 210–300 | 250–340 |
| 310–400 | 350–440 |
| 410–500 | 450–540 |
| 510–600 | 550–640 |
| 610–680 | 650–720 |
| 690–740 | 730–780 |
| 750–760 | 790–800 |
Note on the ceiling gap: The PSAT tops out at 760 per section (1520 total), while the SAT goes to 800 per section (1600 total). This 40-point maximum gap per section (80 points total) is why a perfect PSAT score does not equal a perfect SAT score.
National Merit Scholarship: PSAT Selection Index & Cutoffs by State
For 11th graders, the PSAT/NMSQT serves as the entry point into the National Merit Scholarship Program — one of the most prestigious academic honors available to U.S. high school students. Understanding how recognition tiers and selection cutoffs work is essential for families with ambitious academic goals.
National Merit Recognition Tiers
1. Commended Students (National)
- Selection Index: approximately 207–209
- Recognizes approximately the top 50,000 scorers nationally
- Does not advance to scholarship competition but carries meaningful prestige
2. Semifinalists (State-Specific)
- Selection Index varies by state: typically 207–225
- Approximately top 16,000 students nationally
- Advances to the scholarship application process
3. Finalists
- Semifinalists who complete the application process and meet academic, behavioral, and citizenship criteria
4. Scholarship Recipients
- Approximately 7,500 finalists receive scholarship awards, including corporate-sponsored and college-sponsored scholarships
2026 National Merit Semifinalist Cutoffs by State Tier
The Class of 2026 saw some of the highest National Merit cutoffs ever recorded.
- Lower cutoff states (typically Selection Index 207–212): Wyoming, North Dakota, South Dakota, Mississippi, West Virginia
- Mid-range states (typically 215–218): Most Midwest, South, and Plains states
- Higher cutoff states (typically 219–225): California, Massachusetts, New York, New Jersey, Connecticut, Virginia, Maryland, Washington D.C.
- Record note: Massachusetts and New Jersey both reached a Selection Index of 225 for the Class of 2026 — the highest cutoffs ever recorded for the National Merit Scholarship Program.
Why Math Is Twice as Important for National Merit
Examine the Selection Index formula again: (R&W × 2 + Math) ÷ 10
Because Reading & Writing is multiplied by 2 while Math is added once, improving your R&W score provides twice the Selection Index benefit per point gained compared to improving Math. Students on the cusp of Semifinalist qualification should prioritize R&W prep for maximum National Merit impact.
When Should You Take the PSAT vs. SAT?
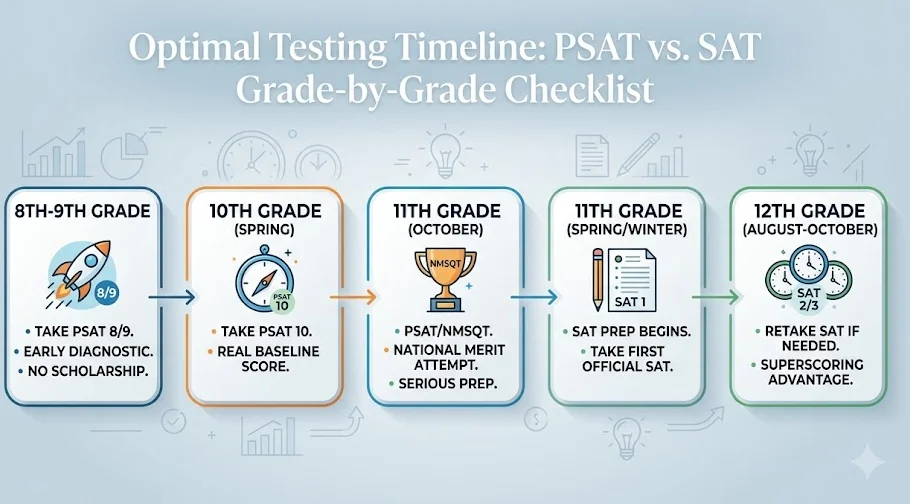
Optimal Testing Timeline by Grade
- 8th–9th Grade: Take the PSAT 8/9 if your school offers it. This serves as an early diagnostic there is no scholarship implication, and it helps familiarize you with College Board’s testing format.
- 10th Grade (Spring): Take the PSAT 10. This is your first look at near-full SAT difficulty. Scores will give you a reliable baseline for SAT goal-setting.
- 11th Grade (October): Take the PSAT/NMSQT this is your National Merit qualifying attempt. Prepare seriously, particularly if you are in a high-cutoff state (California, New Jersey, Massachusetts, etc.).
- 11th Grade (Spring / Winter): Begin SAT prep in earnest using your PSAT/NMSQT results as a diagnostic. Many students take their first official SAT in March, May, or June of junior year.
- 12th Grade (August–October): Retake the SAT if needed. Most colleges practice superscoring, so two or three attempts is a widely accepted strategy.
Should You Take the SAT or ACT in 2026?
As of 2025–2026, the ACT has also undergone significant changes it is now approximately 2 hours for core sections (down from nearly 3 hours), and the Science section has become optional. Students choosing between exams should consider:
- Students who excel in algebra and benefit from more time per question often perform better on the Digital SAT
- Students who are fast readers and prefer a non-adaptive, predictable format may prefer the ACT
- Best approach: Take a full-length diagnostic practice test for each and compare your percentile performance
How to Use Your PSAT Score to Build an SAT Prep Strategy
Your PSAT score report is one of the most valuable and most underutilized resources in the college admissions preparation process. Here is how to extract maximum strategic value from it:
Step 1: Pinpoint Weak Domains
Your score report breaks down performance by domain. Identify which of the four R&W domains and four Math content areas are costing you the most points. A student who scores well in Algebra but loses points in Advanced Math has a very different prep priority than one who struggles with Standard English Conventions.
Step 2: Map Your PSAT Score to an SAT Target
Use the conversion chart above to estimate your likely starting SAT range. Then research your target colleges’ middle 50% SAT ranges (available on their Common Data Sets). Calculate your realistic improvement goal the gap between your estimated SAT starting point and your target score.
Step 3: Prioritize Module 1 Accuracy
Because Module 1 performance determines your difficulty routing and therefore your score ceiling every effective SAT prep plan must emphasize accuracy in the first module of each section. Deliberate, careful answering in Module 1 is more valuable than rushing to finish.
Step 4: Practice in Bluebook
No third-party app fully replicates the Bluebook testing environment. Official Bluebook practice tests (available free via the College Board’s Bluebook app) provide the authentic adaptive testing experience, including the actual UI, calculator, annotation tools, and timer. Bluebook includes full-length practice tests for both the PSAT and SAT.
Step 5: Master the Digital Tools
Many students underutilize Bluebook’s built-in features. Before your SAT, become fully fluent with:
- Desmos graphing calculator: faster than most personal calculators for complex functions
- Highlighting and annotation: useful for identifying key evidence in R&W passages
- Question flagging: mark uncertain answers for efficient review
- Answer elimination: cross out wrong choices to clarify your decision
Step 6: Analytical Error Review
After every practice test, conduct a methodical error review. Categorize each missed question by: (a) content domain, (b) question type, and (c) error type (conceptual gap vs. careless mistake vs. time pressure). This transforms practice tests from score checkpoints into precision diagnostic tools.
Frequently Asked Questions (FAQs)
Is the Digital PSAT easier than the Digital SAT?
Yes, intentionally so. The PSAT is designed as a slightly less difficult version of the SAT, with questions that test the same fundamental skills but at somewhat lower complexity particularly in the Advanced Math content area. This differential is built into the scoring scales: the PSAT tops out at 1520 while the SAT reaches 1600.
Does my PSAT score get sent to colleges?
No. PSAT scores are never sent to colleges as part of the admissions process. Only SAT scores (sent via Score Choice) reach college admissions offices. The PSAT score’s primary significance is as a practice benchmark and, for 11th graders, a National Merit Scholarship qualifying score.
Can I calculate my National Merit Scholarship Selection Index from my PSAT score?
Yes. The formula is: (R&W Score × 2 + Math Score) ÷ 10. For example, a student with 740 R&W and 760 Math calculates: (740 × 2 + 760) ÷ 10 = 224 Selection Index — which would qualify for Semifinalist status in most states.
How long is the Digital PSAT compared to the Digital SAT?
Both tests are exactly 2 hours and 14 minutes the same total duration. The paper-based PSAT was 2 hours and 45 minutes; the paper SAT was 3 hours. The digital format significantly reduced testing time for both exams.
What devices can I use for the Digital PSAT and Digital SAT?
Both exams are taken via the College Board Bluebook™ app, compatible with Windows laptops, Mac laptops, iPads, and school-managed Chromebooks. Students may use their own personal device or a school-provided device. A stable internet connection is required at the start (to launch and authenticate) and at the end (to submit); the test data downloads locally so brief mid-test connectivity interruptions don’t invalidate the session.
How do I prepare for the Digital PSAT using AI tools and online resources?
In 2025–2026, several AI-powered platforms have emerged to complement official Bluebook preparation:
- Khan Academy (official College Board partner) free, personalized practice mapped to your PSAT score report
- Bluebook™ — official full-length adaptive practice tests
- AI tutoring tools — adaptive question generators that adjust to your skill level and provide detailed conceptual explanations
- College Board’s BigFuture School app available from Fall 2025 for all in-school testers
What is the difference between PSAT 8/9, PSAT 10, and PSAT/NMSQT?
All three assess the same core skills but at increasing difficulty levels aligned to grade level. PSAT 8/9 (scored 240–1440) is designed for 8th and 9th graders. PSAT 10 (scored 320–1520) is for 10th graders and is administered in spring. PSAT/NMSQT (scored 320–1520) is for 11th graders in October and is the only version that qualifies for National Merit Scholarship recognition.
How many times can I take the SAT?
There is no official limit. Most students take the SAT 2–3 times. Since most colleges superscore meaning they take your highest section scores from multiple test dates strategic retaking can meaningfully improve your composite score. Admissions officers view multiple attempts neutrally or positively.